
For Hydroscope to work it requires data from your sailling sessions. Once our team receives your data it can begin to enrich it with weather and ship context. The sailing sessions are also segmented into segments and manoeuvres to simplify the discussion and the analysis of your track. This step is necessary for the Hydroscope method, but it requires input from the sailors on your team.
12.1k NM
logged
3380
segments & maneuvers
2.9M
positions
2.1B
data points
data upload #
Hydroscope can ingest any amount of data that you provide from your sailing sessions. Your data can be provided in any open formats and some proprietary ones, and if your format isn’t on the list, get in touch to check if Hydroscope can support it. Currently, supported formats are :
Data should contain at least : latitudes, longitudes and times sampled at no less than 1 data entry / 5 minute for the track of the boat to be defined. From this data, Hydroscope is able to compute the relevant environment variables from the enrichement step. It’s recommended however that the data should contain wind measurements and boatspeed measurements from the boat.
Data from other sensors is also encouraged (IMUs, height measuring equipment, air-temperature, humidity, mast rotation, etc…). Any sensors relative to the state of the boat can be inputed into the ship model such as strain gauges, optical fiber, pressure readings from hydraulic systems, etc…
weather enrichment #
With the track of the boat, Hydroscope can extract the data required for the weather enrichment of your data. Usually Hydroscope can find several sources for each required weather variable, which therefore require careful manual selection to select the most accurate data-sources to set up the environment of the sailing session.
collecting data #
Hydroscope can identify and download all the relevant data (which corresponds to your track in both time and space). This is mostly in the form of weather models in .grib and .nc formats from which Hydroscope can automatically interpolate the track. For the sake of understanding the weather situtation as a whole, bulletins, punctual information, charts and measured timeseries can be added to paint the most accurate picture of the siuation, and to simplify any further re-analysis of the sailing session.
Because of the perishability of weather data, most weather services don’t open their archives to prevent users from downloading out-dated weather predictions. For this reason, Hydroscope, gathers more weather data if you communicate your intention to log a sailing session before the sailing occurs, rather than after the session. This is why Hydroscope actively encourages its users to signify their intention to go sailing ahead of the sailing session to maximise the weather context data available for analysing your track.
environment definition #
The Hydroscope team will manualy inspect the collected data to select the most accurate sources for all the variables defining the weather environment for the sailing session. To do this data sources are cross-examined and compared together (models vs in-situ measurements for instance) to select the most representative data source. In any cas this step is not irrevocable and can be modified, should serious doubts arise on the realism of the data.
segmentation #
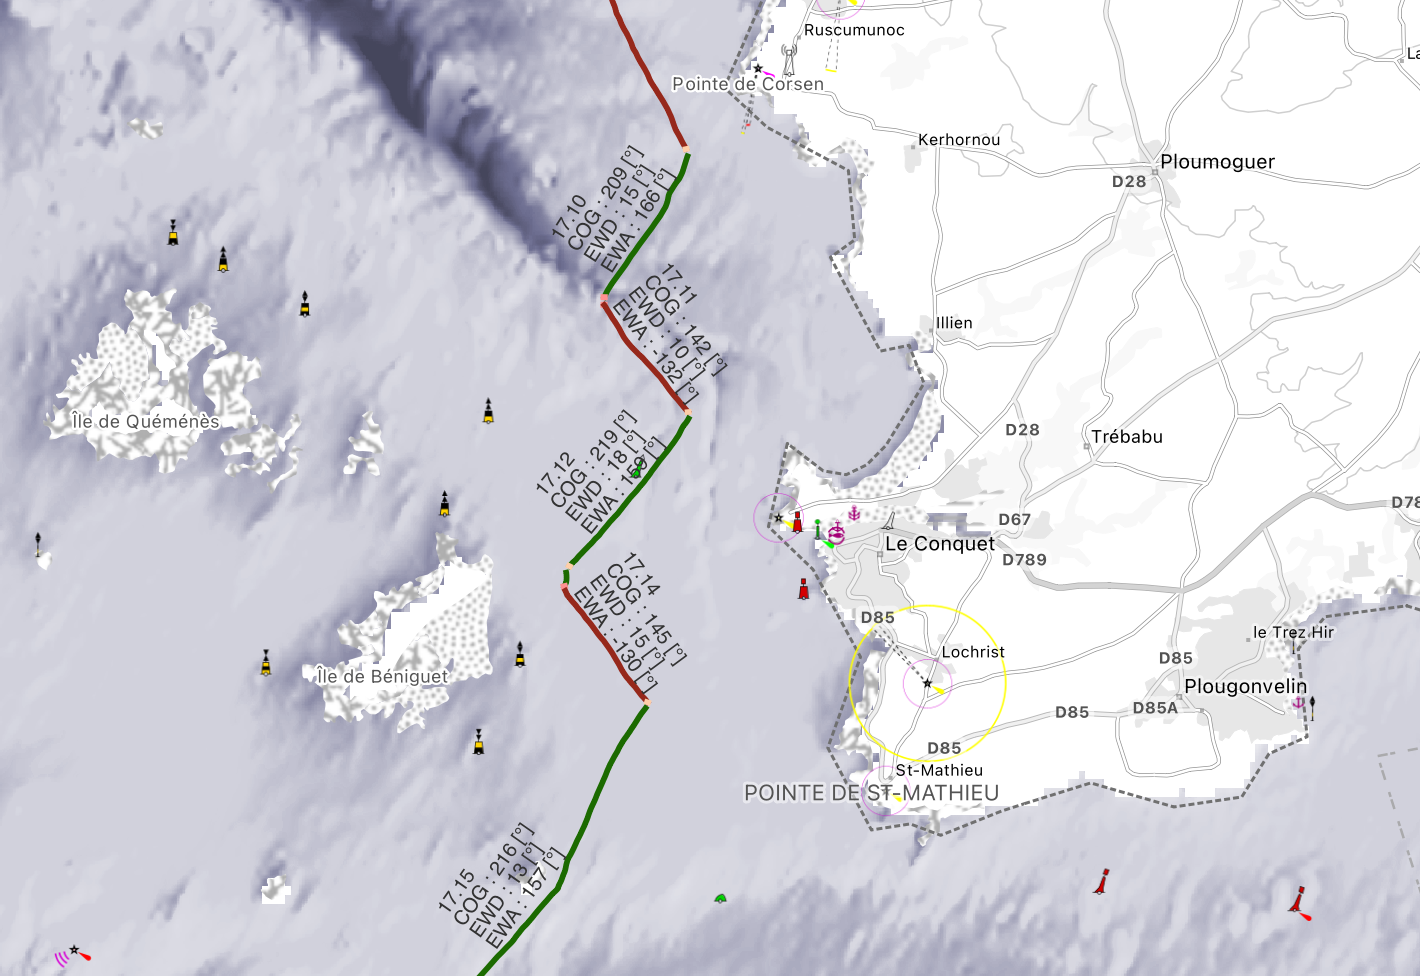
Hydroscope splits tracks into segments to facilitate their analysis. Between each segment a manoeuvre is defined, to distinguish the times when the yacht is in a ’transient’ state.
segments #
To segment the track into segments, Hydroscope uses a custom algorithm on your data. Because sometimes, even the most robust algorithms can fail to distinguish ‘steady’ form ’transient’ state (in pre-starts for instance), the output of the model is manualy checked and edited if needed by the Hydroscope team, to manualy define the segments of your track. This important verification step guarantees your data will be properly analysed down the line.
manoeuvres #
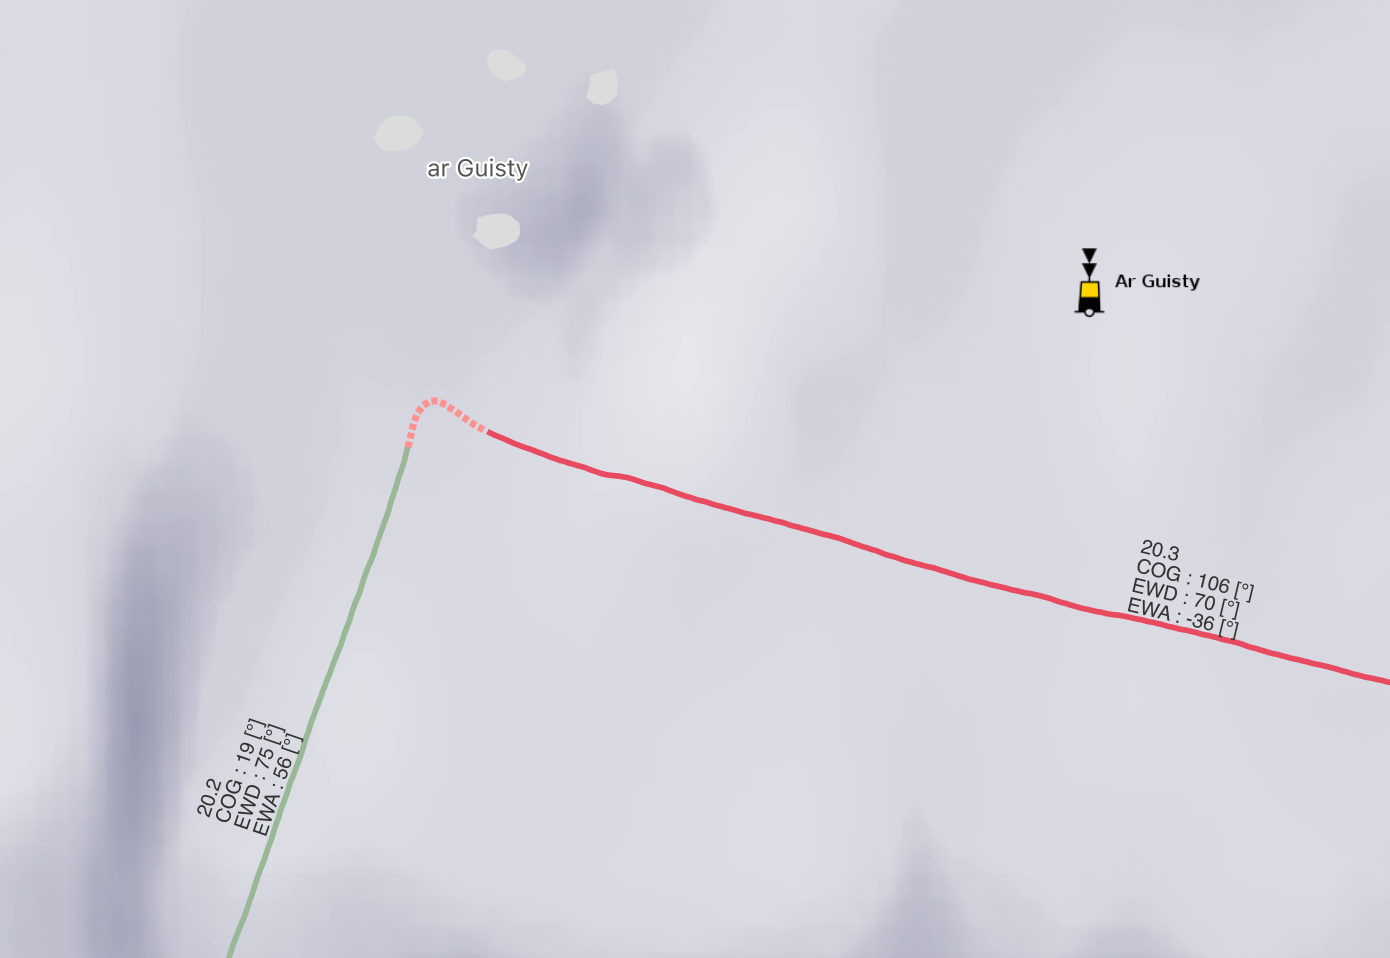
Once the track has been segmented, manoeuvres are defined at the intersection of the different segments. An algorithm is used to attempt the delicate task of defining when a manoeuvre begins and when it ends. This task is particularly difficult as no unique definition of what a manoeuvre is (when it starts and when it ends) exists among sailors, making the task even more difficult for a computer. This is why this step is also manualy inspected to guarantee the quality of the labeling of your data set, and the output of the algorithm can be modified when required.
ship enrichement #
With a segmented track, the state of the ship can then be defined with the ship model on each segment and manoeuvre (or with more granularity if requeried). This requires input from the sailor, who need to describe their session in as much detail as possible to the Hydroscope team for the ship context of the data to be sufficiently rich for analysis. These debriefing sessions should occur as soons as possible after the sailing sessions so that all the details remain in memory. The Hydroscope team is trained to ask the minimal number of questions and take the least amount of time to aggregate this data.
First the set-up of the yacht before it leaves the dock (its manifest) is described, then the trim briefing of the sailing session (what sails to put at each point of sail and how to trim them) is given and finally the configuration of the yacht is double-checked segment by segment to review the whole sailing session and annotate any deviation from the briefing.
These exchanges with the Hydroscope team through any method of communication, also methods that support screen sharing are encouraged to help the discussion progress faster.
manifest #
Correctly describing the state in which the boat leaves the dock can go a long way into explaining the state of the yacht :
- surface state of the hull / appendages
- crew onboard
- sails on board
- bunkering (fuel quantity, fresh-water quantity)
briefing #
The way you intend to configure and trim the yacht, on the water also has to be entered :
- what sail configurations you intend to use upwind, downwind or when reaching
- how you intend to trim them (traveler setting, sheet tension, cunningham, downhauler, tweaker, etc…)
- mast settings you intend to use
- autopilot settings in use
These settings don’t necessarily have to be inputed for each sailing session. If your yacht has a ’tuning guide’, it can be implemented in Hydroscope, removing the need for this briefing step in the debriefing session.
These settings are used as a baseline to annotate the sailing session, but deviations from these settings can be entered manualy.
manual input #
Deviations from the briefing are annotated manually, when reviewing the sailing session segment by segment. These deviations are entered in a table where each segment and manoeuvre are numbered in accordance with the map of the track. Sailors and the Hydroscope team can then easily identify segments where the yacht is functionning as per the briefing and the moments when the boat was not (motoring, accidents, new trim experiments, etc…). The tabled is then filled accordingly, providing the data the valuable ship context it requires.
sail shape analysis #
In some cases, sail trim variables are not clearly computable. Hydroscope includes a tool to compute sail shape from pictures (if they are provided by the crew) to help add this valuable piece of context to the data.